Your wage bill is your biggest variable cost. Are you watching it in real time?
Most venue owners know roughly what their labour costs are. They see it at the end of the week, or when payroll runs, or when their accountant sends a report. By then, the shift is over and there's nothing you can do about it.
Labour is typically the biggest controllable cost in a venue. And it's also the one that moves the most, night to night, service to service. The question isn't whether you're tracking it. It's whether you're tracking it in time to act.

How Workforce Management works with Oolio
When you connect your Workforce Management app to Oolio, your timesheet and shift data flows directly into your Oolio Insights dashboard. Oolio matches what your team is actually working against what your POS is actually taking, in real time, as service happens.
You set it up once, match it to your Oolio location, and tell us how you want to group your staff, kitchen separate from FOH, for example. For each group, you link the staff to the revenue they're responsible for, so your kitchen group itchen is measured against food sales and FOH against the full floor. Then set a target labour percentage for each group, let's say, 20% for kitchen. Oolio will flag it the moment you're running over. After that, it just runs in the background, and keeps you up to date, so you can make real time changes.
What you can see
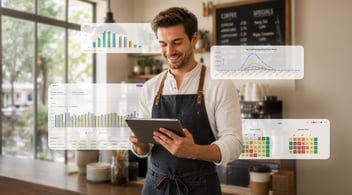
Your Labour dashboard shows you a set of KPIs that update as your team clocks in and out:
Below those, an hourly Labour Pacing Chart shows you actual versus planned spend across the whole trading period, so you can see exactly where things ran hot.
By department, not just the total
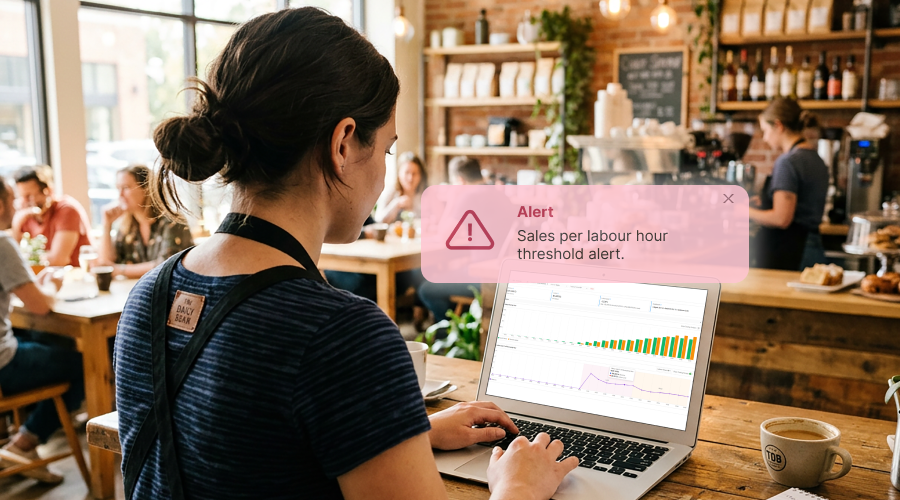
The total labour number tells you something. But knowing your kitchen ran at 58% of revenue during lunch while your FOH ran at 18% tells you a lot more.
The Labour Group Performance grid breaks your labour down by department, showing headcount, hours, spend, revenue, and labour percentage for each group. Set a threshold for what's acceptable, and the dashboard flags it visually when a group crosses it.
That's a staffing call you can make mid-service, not a problem you discover on Friday.
We integrate with the top workforce and labour management tooks. Talk to your account manager about integrating ;it to your Oolio Insights dashboard.